
Google Analytics is a great free tool that will help you track everything about the traffic that you receive on your website.
But many beginners find this tool overwhelming because of the multitude of options and metrics available in its dashboard.
However, if you take the right approach, this tool isn’t difficult to master.
In this blog post, I am going to list down and explain 7 important Google Analytics metrics that you should be tracking for your website.
Let’s check out one by one.
#1 Visitors to Your Website
This is one of the most important Google Analytics metrics to be tracked on any website.
It tells you the number of visitors to your website on a given time period. It will let you track the number of total and new visitors to your website on a day, week, month or any other specific period.
This data can be found under the Audience Overview tab on the left side of your screen.
It can be found here: Left Side Column>> Audience>>Overview (see image below)
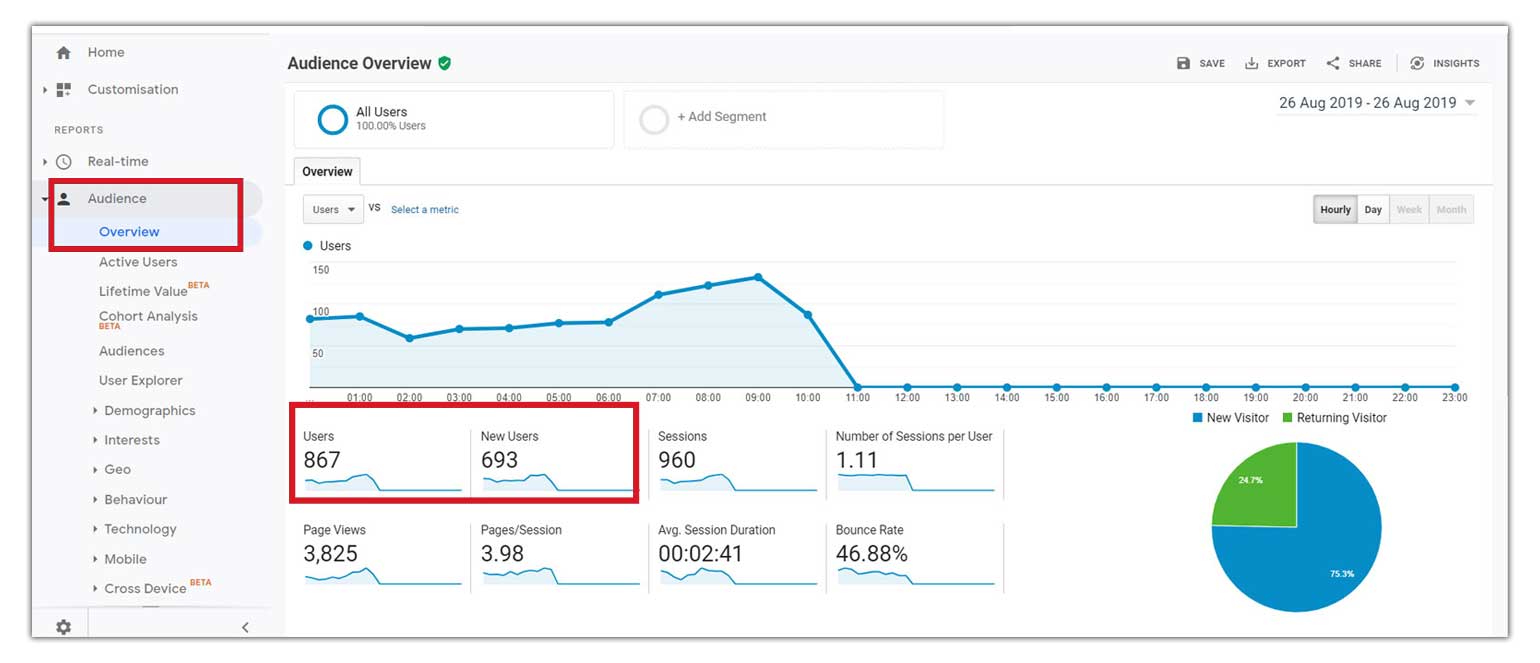
This overview window will also show you important metrics like number of sessions, page views, average session duration and bounce rate.
We’ll be discussing all of them in detail below.
What is a session?
A session is similar to a visit. It is defined by Google as a group of user interactions with your website that take place within a given time frame.
For example, if I start browsing a website and leave the website after 5 minutes, that is called a session and it had a duration of 5 minutes. And if I come back to the same website after 20 minutes, that will be called another session.
If you know the number of visitors to your website, you can look for ways to turn them into leads or customers by optimizing your website.
You will also be able to work on improving the number of visitors to your website by analysing it first.
#2 Page Views
This is something every webmaster should know about. The potential of a website is also dependant on the monthly or daily pageviews that it gets.
So what are pageviews?
It is just the number of pages viewed by visitors to a website in a given time period.
Though we can see pageviews in the audience overview window, there is a better way to do it.
Go to the column on the left side and choose behavior overview.
The steps are shown below.
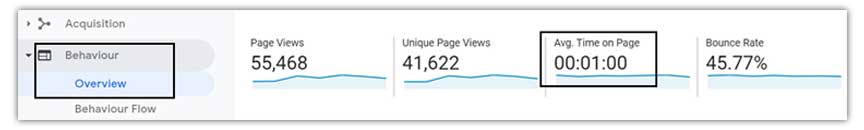
It can be found here: Left Side Column>> Behavior>>Overview (see image below)
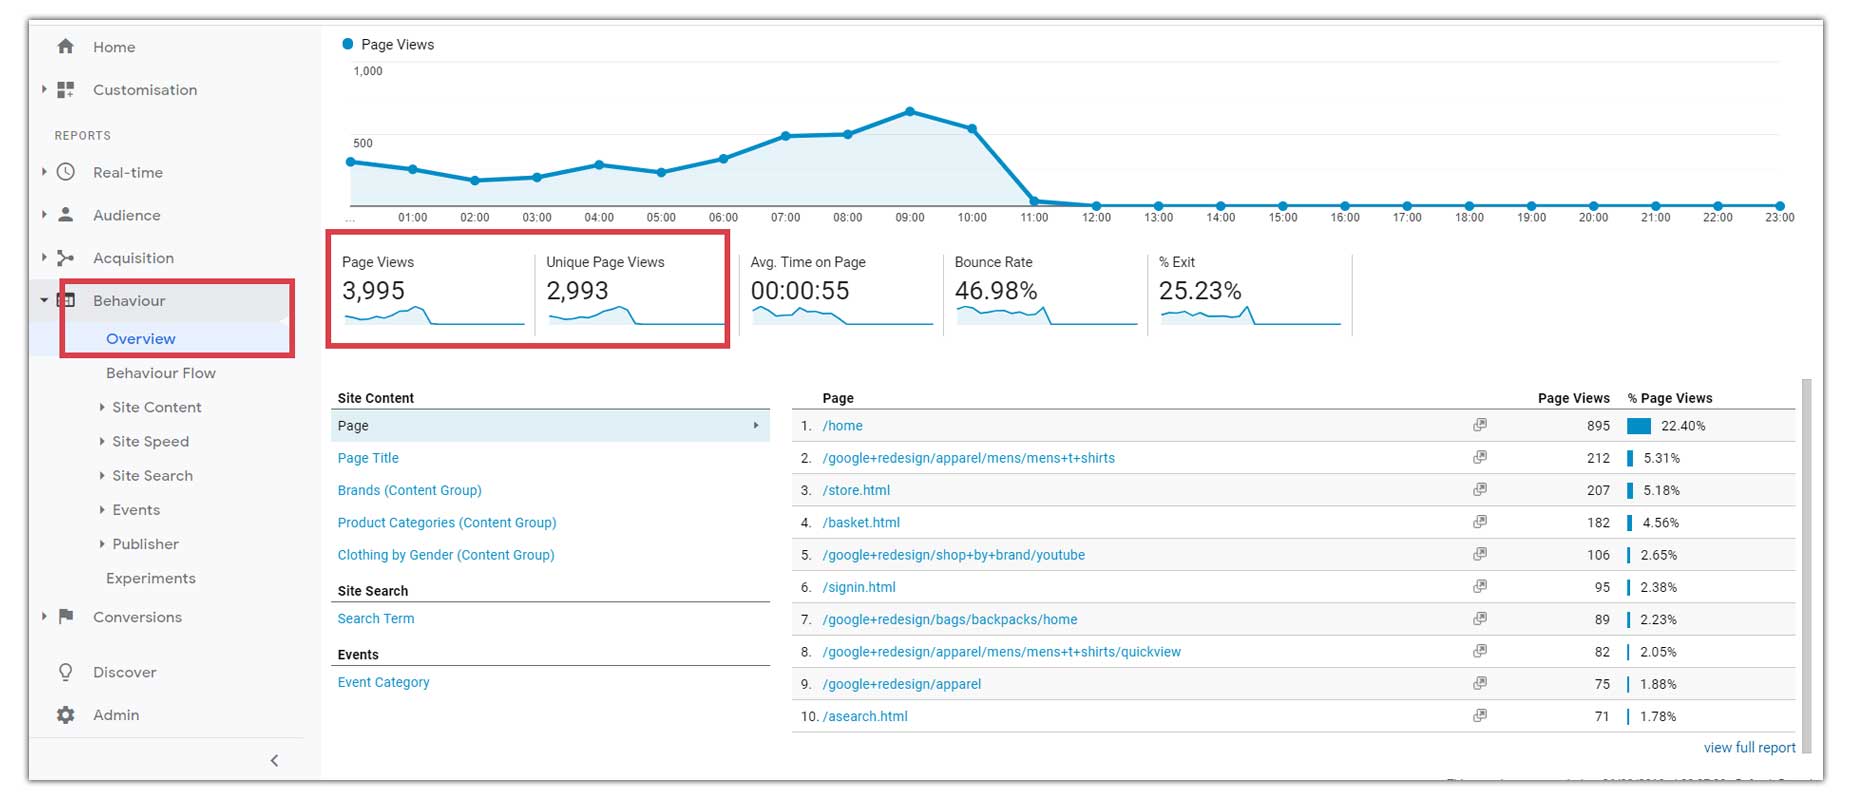
This window will show the page views, unique page views and detailed page wise visit data.
It is important to understand the difference between pageviews and unique pageviews. Pageviews are counted irrespective of the number of sessions. For example, if you visit the same page 4 times during a single session, that will be counted as 4 pageviews.
But it will be counted only as 1 unique pageview as it happened during the same session.
However, if you come back and visit the same page again after 30 minutes on a different session, then there will be 2 unique pageviews in total (for that particular page).
If you see a difference between the number of pageviews and unique pageviews, this is the reason behind it.
All webmasters should be tracking the pageviews of their website to know which are the top pages that are being visited and which pages are getting less visits. Based on this, they can build a strategy to improve the page views of all their web pages and get better leads or conversions from their website.
#3 Traffic Sources
If you manage a website, you should know where your visitors are coming from. You can get an overall picture of your traffic sources in the ‘acquisition overview’ tab.
It will tell you how many of your visitors (users) are coming from organic search, social media, paid search and so on.
Traffic sources can be found here: Left Side Column>> Acquisition>>Overview (see image below)
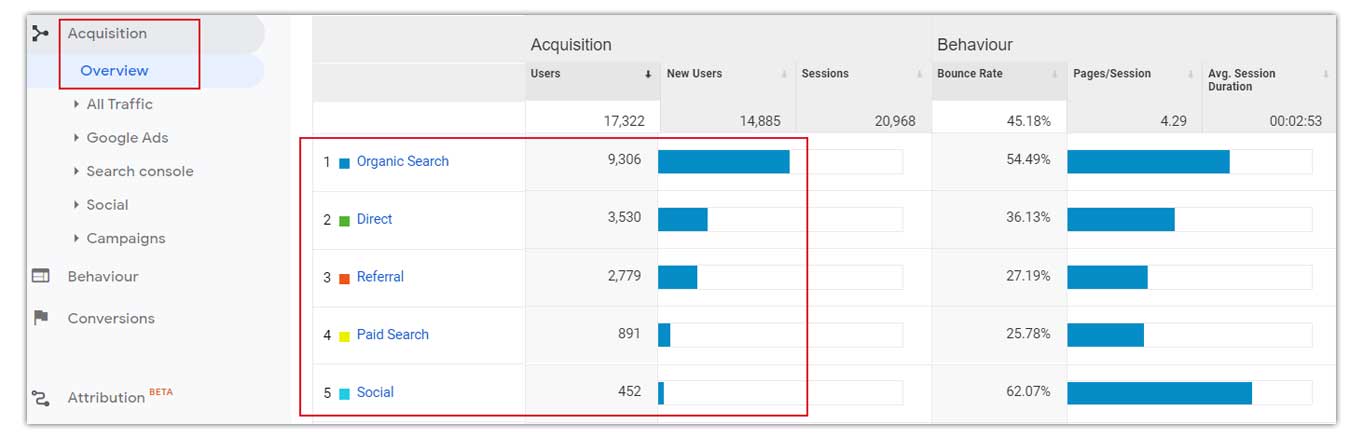
The acquisition overview tab will also show you the number of users, number of new users, sessions and bounce rate with respect to each traffic source.
By clicking on each of the traffic sources, you can get detailed traffic information from all of them.
By knowing the traffic sources of your website, you can decide which source you want to focus on more. For example, if you are getting most of your traffic from SEO, you might want to also find out the keywords that are bringing traffic to your site.
You can use a free tool like Google Search Console to find out the keywords that you are ranking for. This will help you better optimize your web pages according to those keywords and you can also find out more keyword opportunities that might work for you.
#4 Bounce Rate
Bounce rate is defined by Google as the percentage of visitors to a particular website who navigate away from the site after viewing only one page.
If your website has a high bounce rate, that could be because of an unattractive or irrelevant page where the visitors land first.
You can find the bounce rate of your website under the Audience Overview section.
It can be accessed at: Left Side Column>> Audience>>Overview
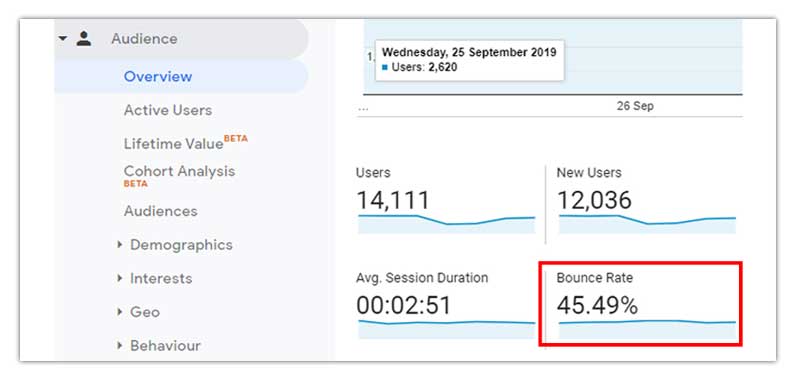
On an average, the bounce rate of websites range between 40% to 60%. If your website’s bounce rate is way above 60%, you really need to look at why your visitors are navigating away from the first page they are landing on.
Interestingly, the bounce rate of websites also vary across industries, but still within the 40% to 60% window mentioned above. Here’s a detailed article about how bounce rate varies across industries.
If you are getting a lot of bounces on your website, you can try improving the structure, content, images and importantly the relevancy of your pages. (i.e. if people are looking for bluetooth headphones and landing on your webpage, show them bluetooth headphones, not an LED TV or something else)
#5 Time on Page
This is simply the average time visitors spend on any of your webpages. If your website visitors stay on your pages for a longer time, that means your website has interesting and relevant content to your users. A longer time on page will also help you rank higher on search engines.
This metric can be seen on: Left side column >> Behaviour >> Overview
Below the ‘Behaviour’ tab, you can click on ‘site content’ and ‘all pages’ to get a detailed view of all your pages. This will show you how much time users are spending on each of your website pages.
Page wise time spent data can be seen here: Left side column >> Behaviour >>Site Content >> All Pages (see image below)
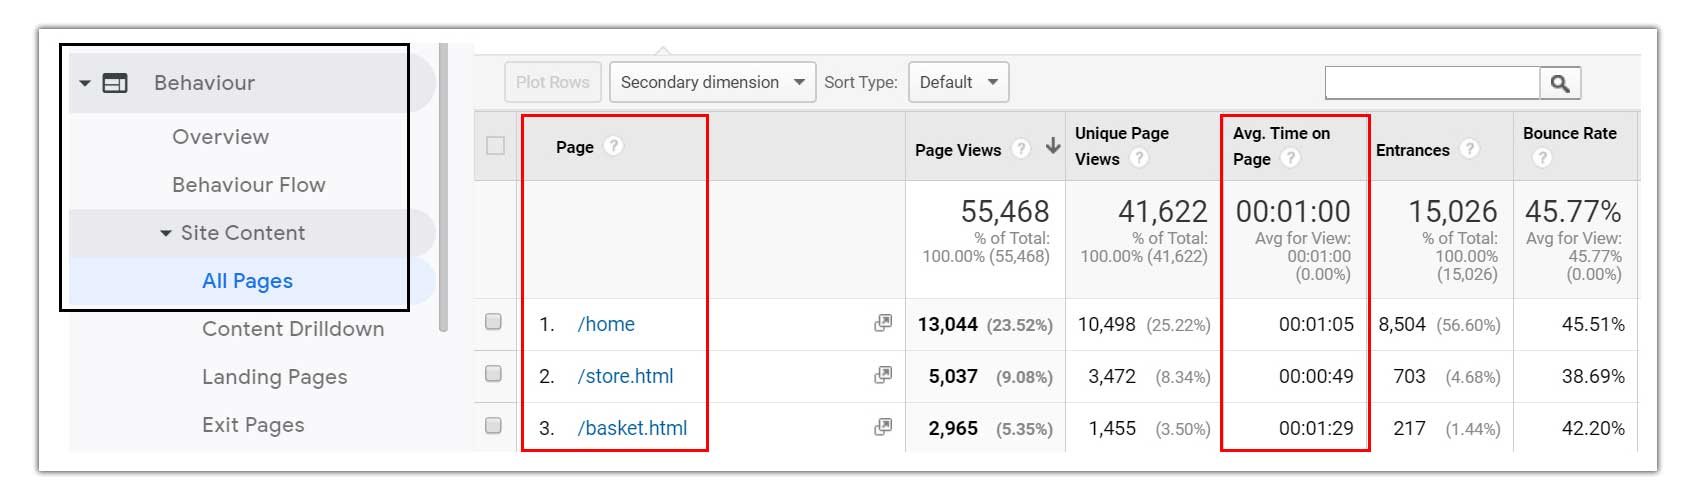
This metric will tell you which of your pages are hooking your visitors more.
By knowing the time users (visitors) spend on your webpages, you can work on improving pages that are performing poorly, i.e. pages where users spend less time.
Also, it would be a good idea to work on high performing pages to convert your visitors into email subscribers or paying customers. This can be done by creating a funnel which can drive visitors from your top performing pages to a squeeze page or a product/sales page.
#6 Demographics & Location
You should also be tracking the demographics and location of your website visitors, so that you can tailor your digital marketing strategy to better address your target audience.
This data can be found under the ‘Audience’ tab within the left sided column in Google Analytics dashboard.
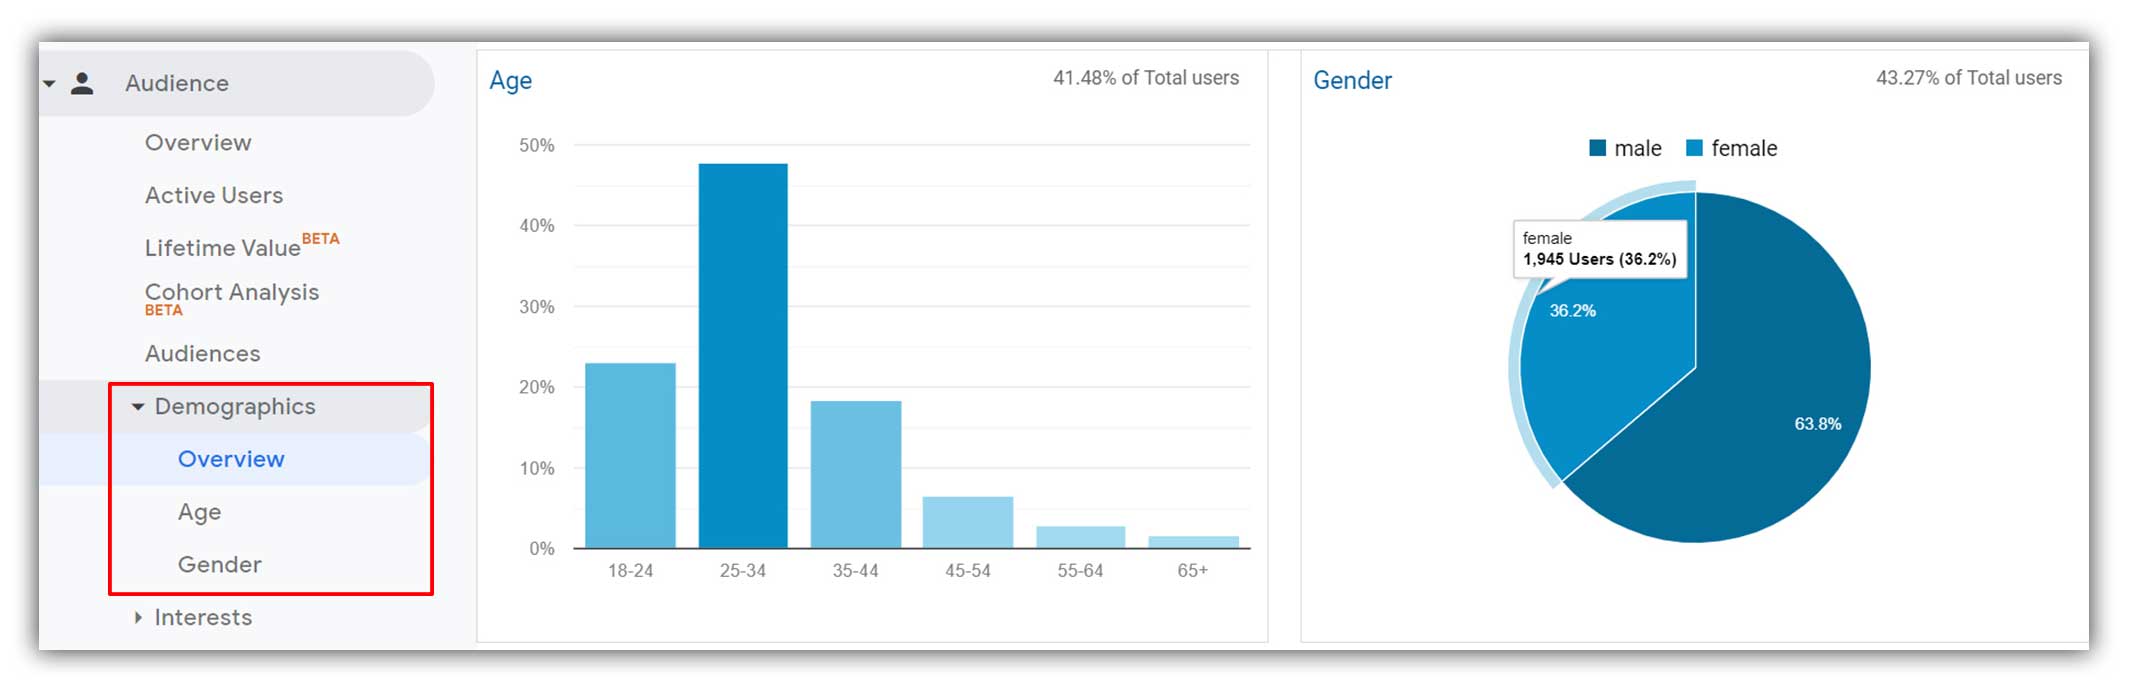
It can tell you the age, gender, location and devices used by your website visitors.
Demographic data can be found here: Left side column >> Audiences >> Demographics (see image below)
Location data can be found here: Left side column >> Audiences >> Geo (see image below)
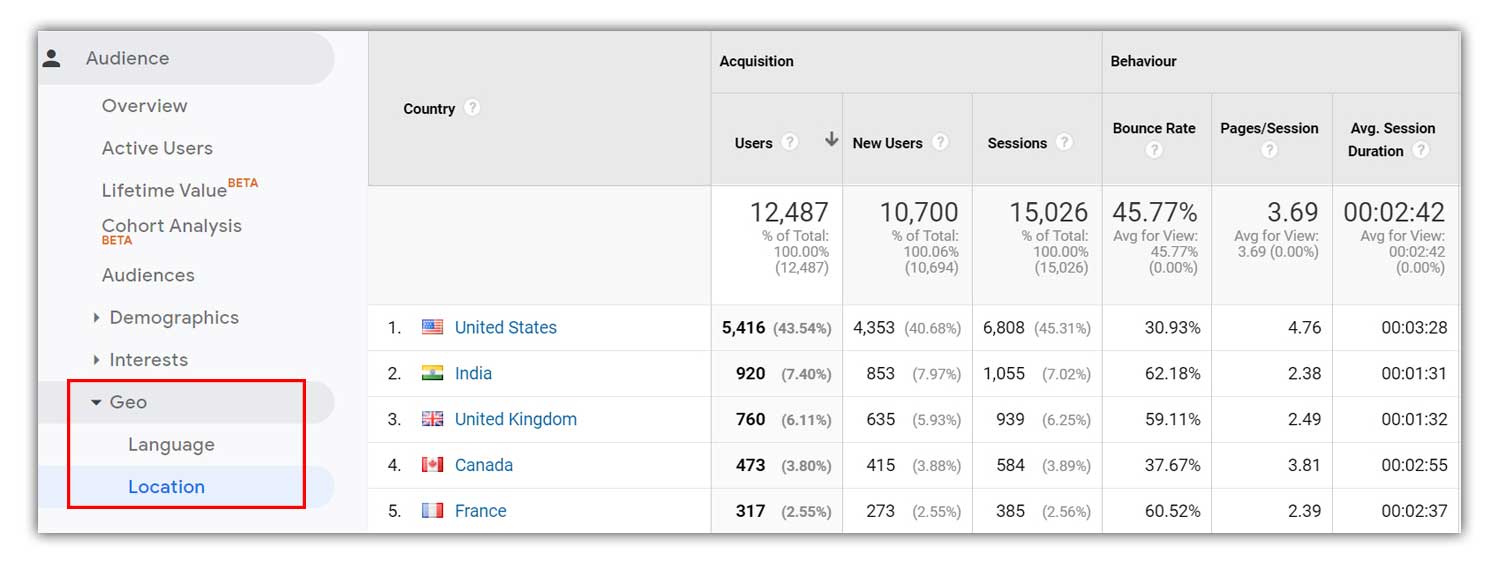
The demographics and location of your visitors can tell a lot about how effectively your website is brining you prospects. For example, if your business offers services only in Mumbai, India, you should be getting traffic from that location. Similarly, if you are targeting students who have just completed their bachelor’s degree, you should majorly be having users from that age group among your website visitors.
Insights from demographics and location data will help you build better targeting strategies through paid advertising as well as SEO.
#7 Goals
Your Google Analytics custom goals are your go-to metric to analyze your website performance more thoroughly. It will simply tell you how effectively your website is driving desirable actions from your visitors.
You can set up your own custom goals within your Google Analytics account to track these specific actions taken by your website visitors.
These actions can be filling up a contact form, visiting your sales page, watching a video or even making a purchase. So just by looking at your goal conversion stats, you’ll be able to understand the relevancy of the traffic that you are receiving, specific actions your visitors are taking and how many of them are really interested in your product or service.
Goal conversions, as they point to a desirable action on your website, are always more valuable than the number of visitors or page views that you get.
As an example, if a website gets 1000 visitors in a day but hardly gets 1 or 2 form fill-ups (goal conversions), that isn’t really going to help the business grow. Eventually, more than the number of visitors or pageviews, businesses should concentrate more on meaningful actions (goal conversions) on their website.
Now that we know why goal tracking is important.
Let’s look at the steps to set up and track goals in your Google Analytics account.
Setting up Goals in Google Analytics
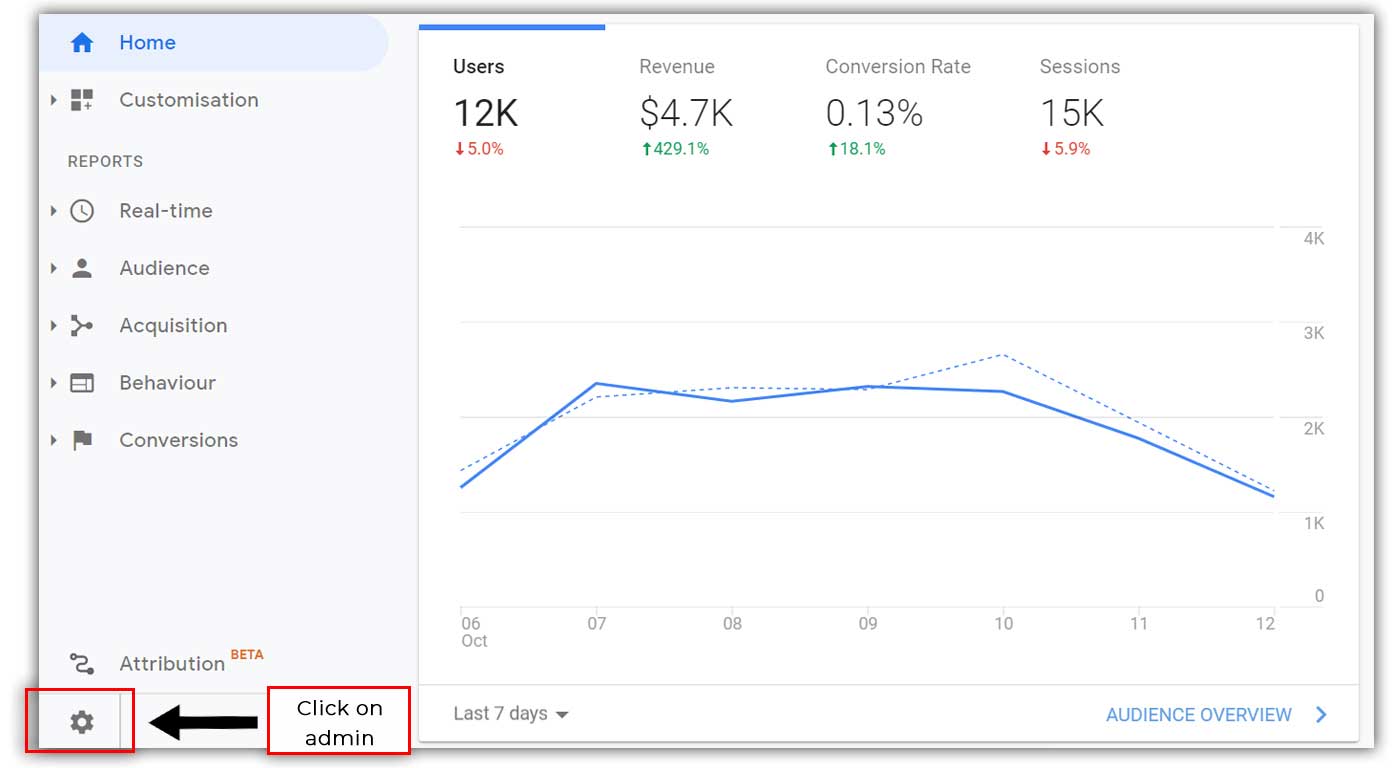
Step 1.
Click on ‘admin’ at the bottom left corner of the Google Analytics dashboard. (see image below)
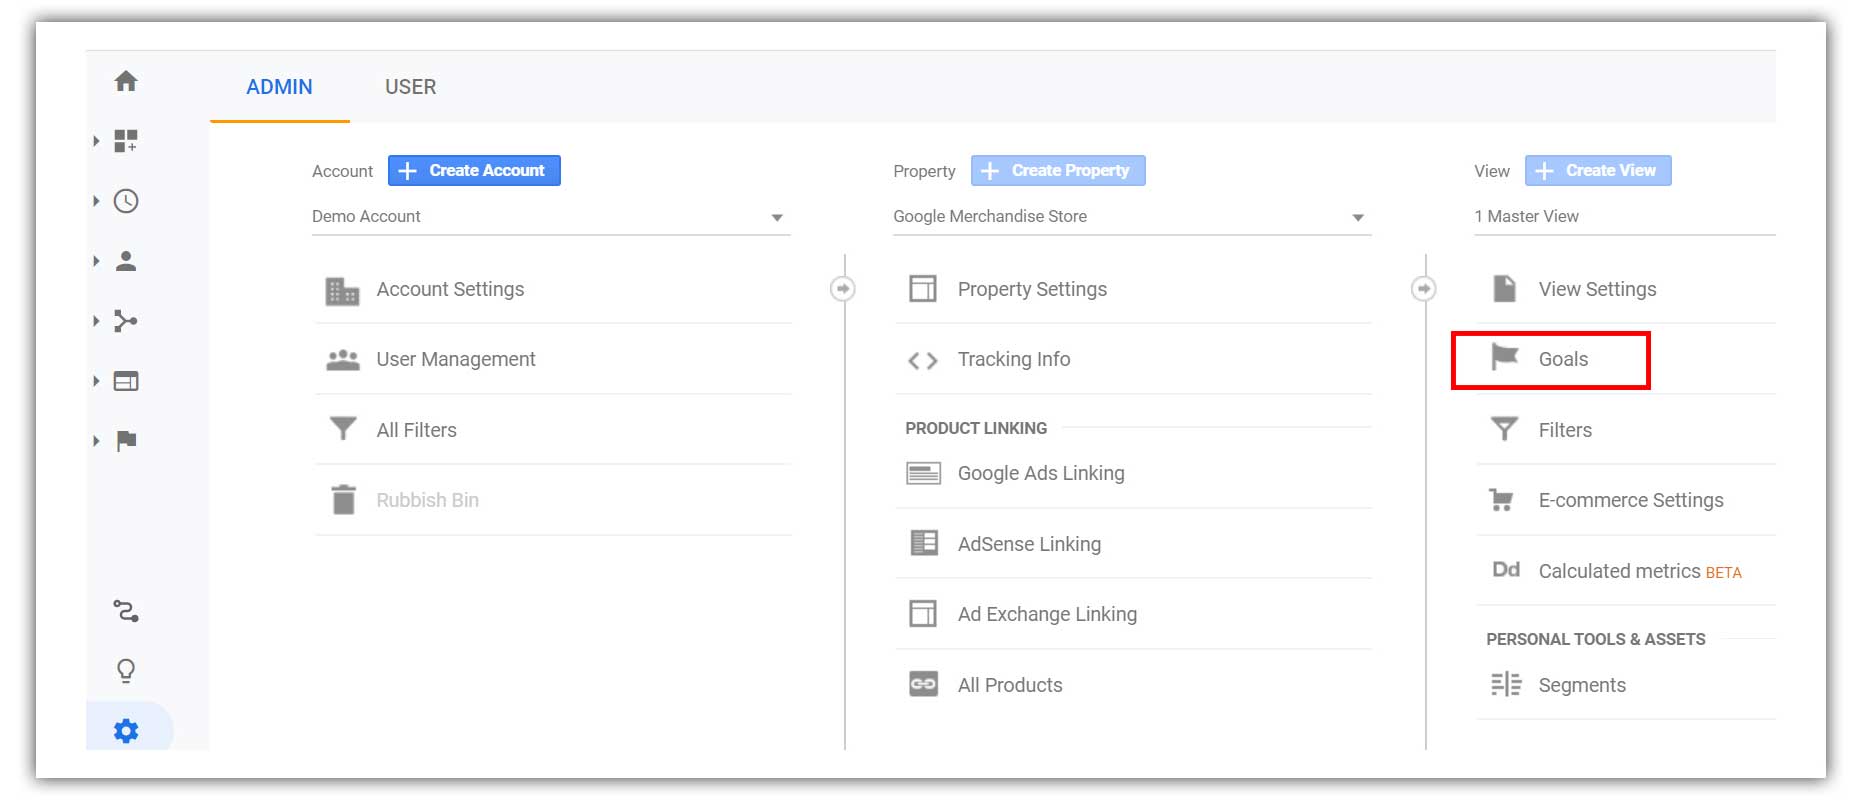
Step 2.
Click on goals within the admin window (see image below)
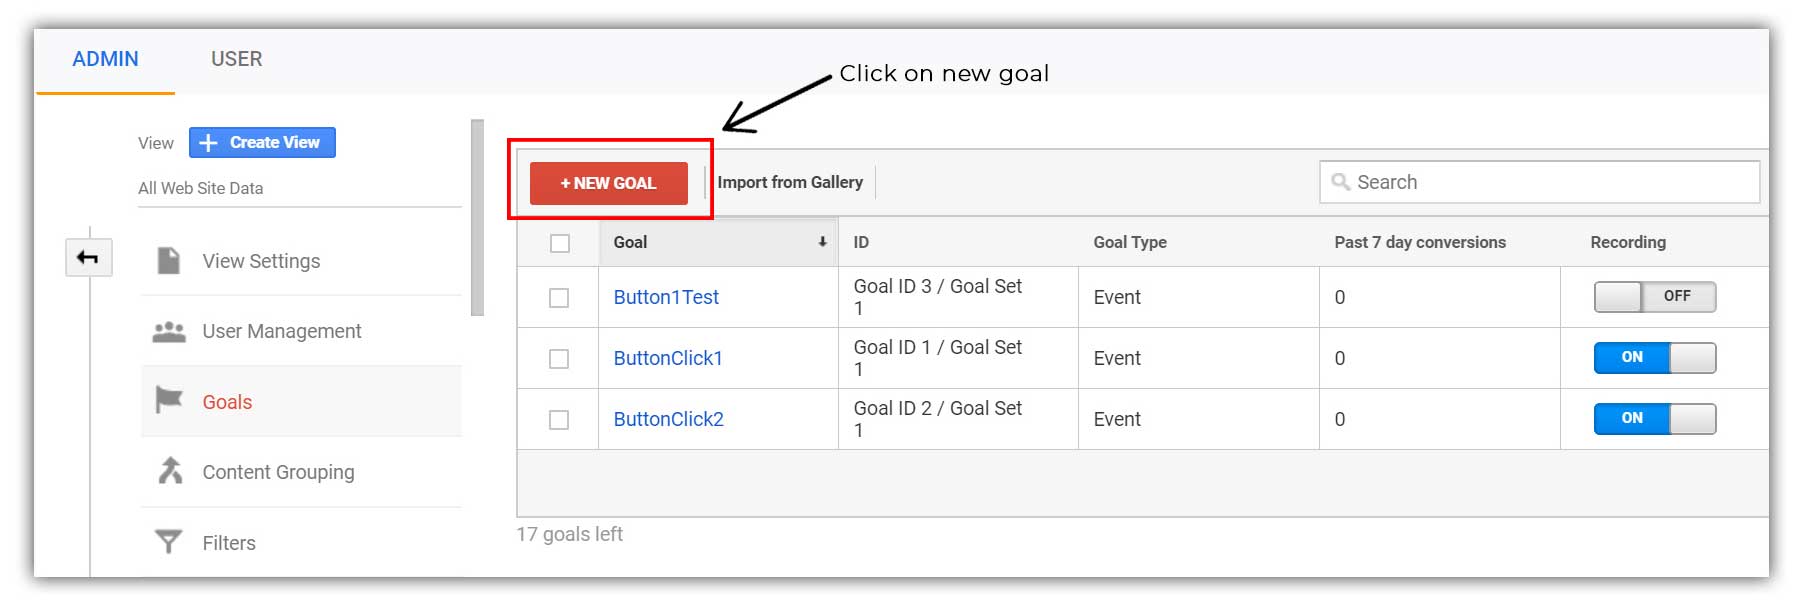
Step 3.
In the next window, you can see if you have any goals set up already. You can also set up new goals here by clicking on ‘New Goal’. (see image below)
Step 4.
Once you have clicked on the ‘new goal’ button, you will be taken to a page where you can choose between goal templates and custom goals.
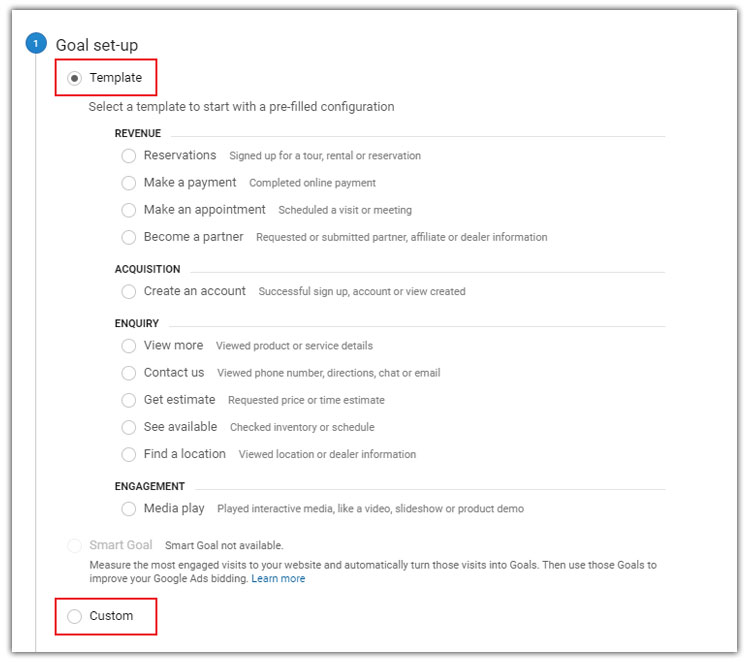
Goal templates include preset goals that fall into revenue, acquisition, enquiry and engagement categories.
For example, you can track customer reservations occurring through your website with the ‘reservations’ goal under revenue category. (see above image)
Or you can choose to go with custom goals where you can define a goal the way you want it. This could be used when you have a specific action that needs to be tracked and it is not available within the goal templates.
Step 5.
After choosing one of the goal templates or a custom goal, you will be directed to the next window where you can actually set up the goal tracking.
As shown in the image below, if you choose a custom goal, you will be asked to enter a goal name to be tracked.
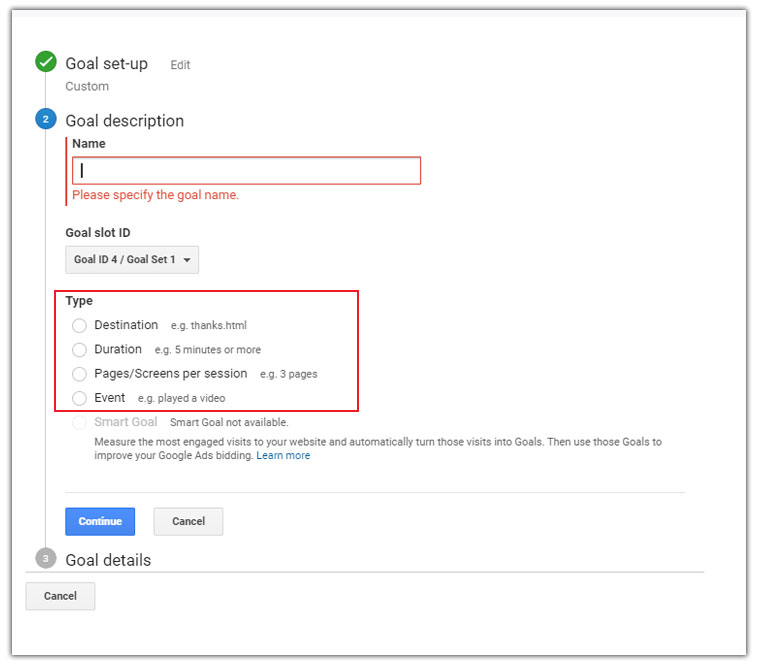
Below the goal name, you will have a few types of goals from which you can choose one to set up.
Let’s look at the different types of goals available.
1. Destination
This goal type can be used when you need to track visitors landing on a specific page. This will work well if you have a sign-up form where the users will be redirected to a thank you page after signing up.
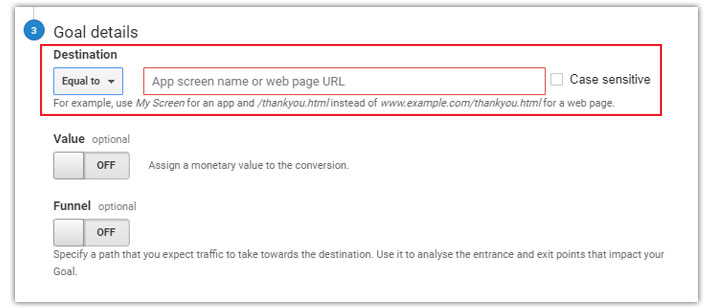
For example, if someone lands on the page www.example.com/thank-you after filling up your form, it will be counted as a goal conversion.
2. Duration
If you want to track how many of your visitors are spending a certain amount of time on your website, this type of goal can be used.
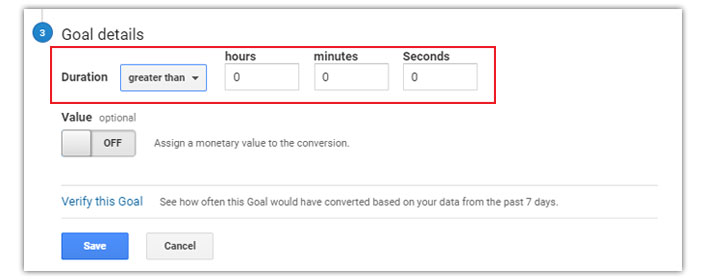
You can just enter the desired time duration while setting up this type of goal. Once a visitor stays on your site for that specific time period, it will be counted as a goal conversion. The duration can be mentioned in hours, minutes or seconds. This type of goals will help you in understanding how your users are engaging with your website content.
3. Pages/Screens per Session
Pages/Screens per session goals can be used to measure how effectively your users are engaging with your website content.
With this type of goal you can track how many of your visitors are visiting a certain predefined number of pages during a single session.
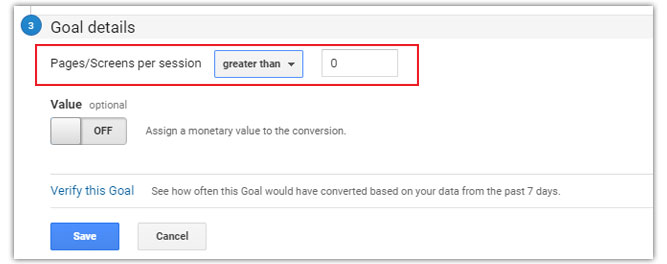
For example, if you want to track how many of your visitors are viewing 2 or more pages on your website, you can set it up by entering the number of pages as shown in the image above.
If your visitors are viewing more pages on your website on a single session, that indicates they are engaging well with your website content.
4. Event
An ‘Event’ allows you to enable advanced tracking options in Google Analytics. It can help you track events like button clicks and video views.
To set up events, you will first have to add the event code to the associated element. For example, if you want to track a button click, you will need to add the event code to that button.
An event tracking code would normally look like this.
onclick=ga(‘send’, ‘event’, [eventCategory], [eventAction], [eventLabel], [eventValue]);”
Now, if you are a person with no coding background, you might find it a little difficult to set up these event codes within your element that needs to be tracked.
But luckily, this can be done without any coding efforts.
You can use a tool like Google Tag Manager to set up custom events in your website and then create goals associated with these events in your Google Analytics account.
To create these goals in your Google Analytics account, you will have to enter the event parameters like category, action, label and value as shown in the image below.
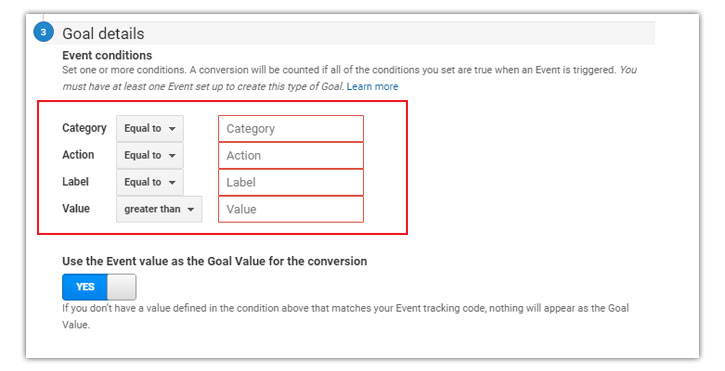
Once you have entered all these details properly, your goals are ready to be tracked.
Now, to see how your goals are performing, you will need to access them within the Google Analytics dashboard.
Your custom goals can be seen here: Left side column >> Conversions >> Goals >> Overview
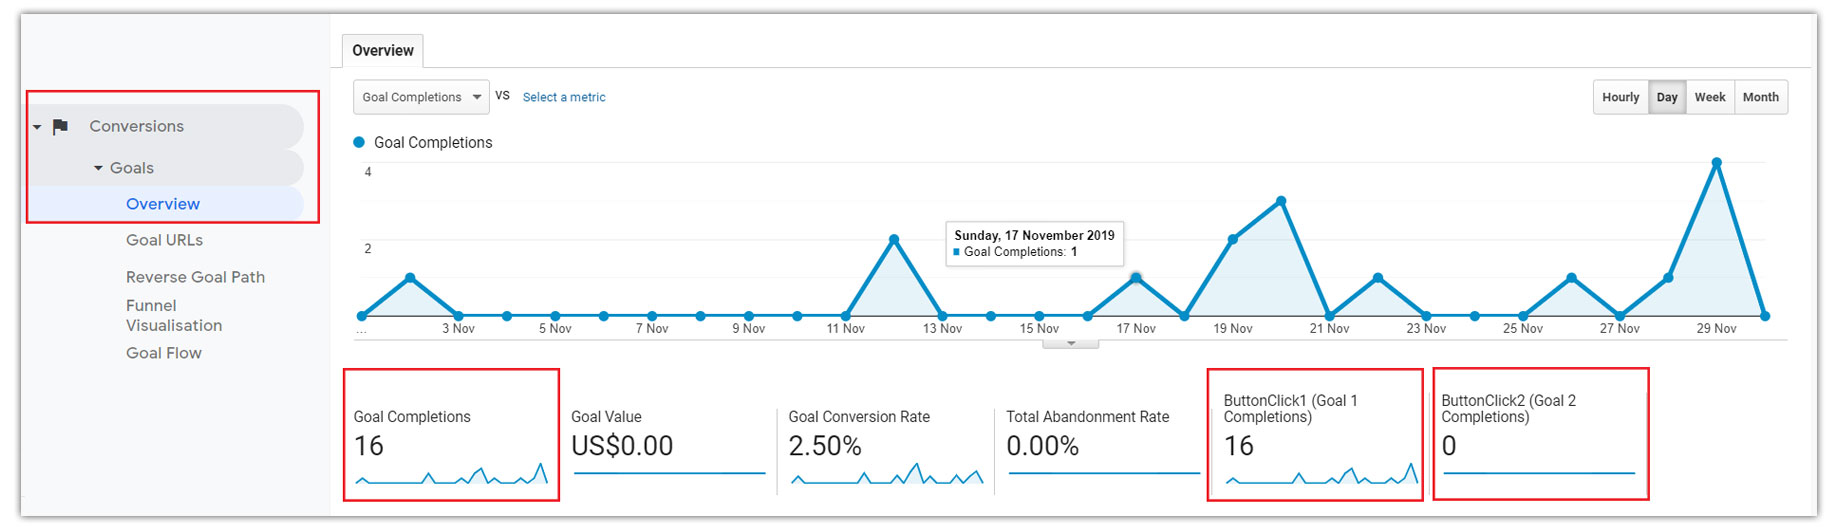
The goals overview section will show you all the goals that you have set up within your Google Analytics account. It will also show you the number of goal completions, goal conversion rate and goal value if you have set up one.
The goals tab has many more options like goal URLs, funnel visualization and goal flow. However, you will be able to get a holistic view of your website goals from the overview tab.
Conclusion
These aren’t the complete set of metrics that you can get out of Google Analytics.
But if you are just starting to play with Google Analytics or want to keep track of your business website’s performance during a busy schedule, these 7 metrics can come in handy.
Start tracking these 7 metrics on Google Analytics and you will be able to take better decisions to improve your traffic and conversions.
Have a query or a feedback?
Feel free to leave a comment below, I’ll be happy to respond.
All the best.


Amrita
Great Article!